Tracking your visitors activities on your site/blog helps in learning what user wants, what they like and what they dislike.
Knowing things like where your visitors came from and where they left your site. Maximum analytic tools help you know the bounce rate, that is, how many visitors consists of only a single page view.
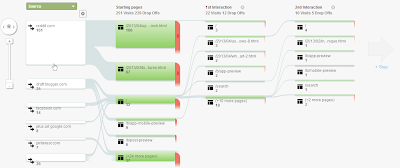
Having a graphical traffic flow, makes a lot of sense and makes study of your traffic flow a lot more easier.
 |
| Click to enlarge |
How to track Visitor Flow?
- Log-in into your Google Analytics account.
- Select your site data from the list that opens up.
- Navigate to 'Traffic Source' > 'Source' > 'Visitors Flow'.
Select the filter. First column will show the filter based category, second column will show the first page that a user landed on after getting redirected. The third column shows the first interaction, this is when a visitor opens some other page after the landing page. After first interaction use '+Step' to see more interactions, more page accessed one after the other.
Highlighting a specific flow
After selecting the filter, if you want to track traffic flow or activity you need to track how visitor flow from one page to next that started from a specific source. Here, highlighting comes in just click on any source or any interaction and then select 'Highlight traffic through here'. Doesn't matter, in which interaction you selected to highlight, the entire path from beginning till end will get highlighted.Exploring a specific traffic flow
Another great option, especially for high traffic sites. Lets say that you have more than 500 visitors per day then there starts a need to explore the flow in depth. Causes of sudden drops, what visitors like the most. To deal with this right click on any column entry or any interaction and select 'Explore traffic through here'.An other way to do so is using the magnifier '+' button. But this will only widen up the chart, still lesser insight and details.

No comments:
Post a Comment